Cashback Websites Ranked by What You Actually Earn Per Purchase
What you'll learn in this guide:
- How actual cashback earnings differ from advertised rates
- The comparison framework you need: base rates, category bonuses, payout speed, thresholds, and deductions
- Real annual earnings data from major platforms
- How Snaplii compares as a North American alternative
- Frequently asked questions about maximizing your cashback
When you scroll through cashback website ads, the numbers look irresistible. One platform promises "up to 40% back." Another advertises "earn on every purchase." But what do you actually earn per transaction?
The gap between advertised and real earnings explains why some shoppers make hundreds of dollars yearly while others earn just a handful. This guide ranks cashback websites by the earnings that matter most: what reaches your pocket, not what marketing teams claim.
Understanding the Earnings Gap
Cashback marketing almost always shows maximum rates under ideal conditions. A website might advertise "up to 15% back" when only one specific retailer offers that rate during a limited promotional period. The fine print? Most everyday stores deliver 1 to 3% back, or nothing at all if they are not part of the platform's network.
The comparison framework that reveals actual earnings has five key components.
Base rate represents what you earn on everyday purchases without category bonuses or promotions. Most platforms offer 0.5 to 2% on general purchases, though some charge nothing if you shop outside their partner network.
Category bonuses apply to specific purchase types like groceries, restaurants, or gas. These can push earnings to 5 to 12% for targeted shopping but disappear completely if you buy outside those categories.
Payout speed affects how quickly you access earnings. Some platforms hold funds for 60 days. Others process payments within 5 to 7 business days. The delay determines whether earnings accumulate faster than you can redeem them.
Minimum threshold is the amount you must earn before you can withdraw or redeem. Platforms range from zero minimum to $20, $50, or higher. Low thresholds accelerate actual earnings access. High thresholds trap small earnings indefinitely.
Hidden deductions include transfer fees to bank accounts or promotional terms that vanish unexpectedly. Platforms that waive these fees deliver more of your earned rewards.
Platform A: High Rates with Delayed Access
Platform A attracts users with "up to 40% back" claims at 3,500+ partners. Real earnings tell a different story.
Most everyday retailers on this platform deliver 1 to 4% back. Only during limited promotions or at specific stores does the 40% rate appear. The platform offers no minimum payout threshold, which is positive, but earnings must be redeemed through PayPal, gift cards, or annual direct deposits. This creates friction compared to faster withdrawal options.
Testing data shows active users of this platform earn approximately $127 over six months with consistent shopping. That translates to roughly $250 yearly for regular usage, assuming you shop frequently and hit bonus categories. Seasonal promotions boost this figure, but they are temporary.
Platform B: Near-Complete Earnings Transfer
Platform B negotiates higher commission rates with retailers and returns nearly 100% of earnings to members. The platform's comparison framework includes 1 to 35% back depending on the retailer, with the higher end reserved for specific promotions.
The advantage here is withdrawal flexibility. This platform allows payouts at any time with no minimum threshold. Earnings reach your account quickly, typically within 5 to 10 business days via PayPal or direct bank transfer.
This speed and flexibility mean more of your earned rewards translate into actual cash. A typical user might earn $150 to $300 annually on moderate spending, with faster access than competing platforms.
Platform C: Grocery Dominance with Modest Earnings
Platform C focuses exclusively on grocery and retail receipts. Users upload receipts, and the platform verifies purchases before crediting rewards.
This model generates 1 to 4% back on groceries and selected retail stores. Testing over six months showed Platform C users earning approximately $89, or roughly $180 yearly. The advantage lies in consistency. Grocery spending happens regularly, and this platform's offers align with that routine.
The minimum threshold of $20 represents a moderate barrier. Many grocery shoppers reach this within a few weeks of regular use. Platform C processes payouts through PayPal or direct bank transfer within 2 to 3 business days once the threshold is met.
Platform D: Specialized High Rates for Gas
Platform D focuses on gas, dining, and groceries with earnings reaching 25 to 45 cents per gallon at participating stations. This specialization creates the highest per-transaction rewards available.
For gas purchases, Platform D delivers 10 to 20% back or more on a gallon. The catch is limited merchant acceptance compared to general cashback platforms. If you shop only at one gas station or a few chains, this platform excels. If you rotate stations, earnings drop dramatically.
Platform D redemptions process through PayPal, Venmo, or gift cards with no minimum threshold. Real earnings from gas alone average $50 to $150 annually depending on driving habits, making this platform valuable as a supplement rather than a standalone solution.
Platform E: Receipt-Based Alternative
Platform E operates on receipt scanning like other grocery-focused platforms but covers broader retail categories. Users earn points by photographing receipts from grocery stores, pharmacies, and select retailers.
The earnings framework here is opaque. This platform does not publish consistent percentage rates. Points accumulate slowly, and real annual earnings from testing average $410 for very active users, but typical users earn much less. The 12.5 million active user base suggests low per-user engagement.
Redemption options include PayPal, Venmo, and gift cards. The lack of transparent rates makes Platform E harder to compare directly, but it functions well as a supplementary cashback source for existing receipt-saving habits.
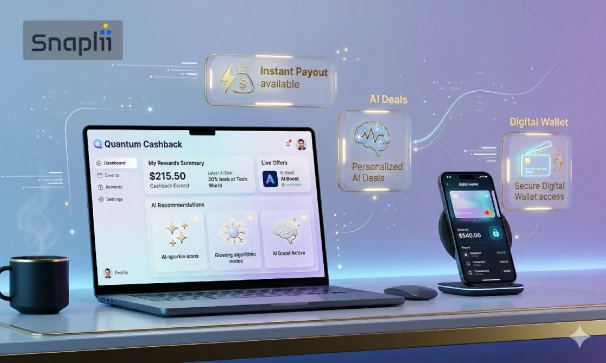
How Snaplii Compares on Actual Earnings
Snaplii operates as a North American cashback platform with 500+ brand partners. The typical cashback rate spans 5 to 12%, placing Snaplii above base rates on most competing platforms and competitive with category bonuses.
The Snaplii comparison framework works like this. Partner networks cover major retailers across grocery, dining, fashion, and travel. Rates of 5 to 12% apply consistently across purchases, not just promotions. The platform accepts WeChat Pay, Alipay, debit, and credit as payment methods, broadening access for North American users.
One critical distinction: Snaplii Cash is reserved exclusively for future gift card purchases. You cannot withdraw Snaplii Cash directly to a bank account. This differs from competitors, which enable direct withdrawal. However, Snaplii Cash remains available indefinitely, allowing unlimited accumulation toward gift card purchases.
On actual earnings, a Snaplii user spending $200 monthly on partner purchases at an average 8% rate earns roughly $192 yearly in Snaplii Cash. This compares favorably to other platforms earning approximately $250 yearly or $180 yearly when calculating like-for-like scenarios. The advantage increases with higher average cashback rates.
The payout structure represents a tradeoff. Snaplii's restriction to gift card redemption appeals to shoppers with regular gift card needs. Users who demand bank account flexibility may prefer competing platforms despite lower earning rates.
Frequently Asked Questions About Cashback Comparison
Q: Which cashback website earns the most per purchase?
A: The gas-focused platform delivers the highest per-transaction earnings on specific categories (gas reaches 25 to 45 cents per gallon), but Platform B offers the best balance of rates and accessibility. For consistent all-category shopping, rates of 5 to 12% through Snaplii outpace the 1 to 4% baseline on most competitors.
Q: Do hidden fees reduce cashback earnings significantly?
A: Legitimate cashback platforms claim to be fee-free. Platform B and Platform A charge no withdrawal fees. Platform C and Snaplii function without fees. However, minimum thresholds and payout delays reduce practical earnings access, creating an invisible cost through delayed redemption.
Q: How long does it take to earn meaningful cashback annually?
A: A moderate shopper using one primary platform earns $150 to $300 yearly. Very active users or those stacking multiple platforms reach $500+. This assumes consistent monthly spending of $200 to $500 and engagement with category bonuses. Casual users should expect $50 to $150 annually.
Q: Can I use multiple cashback websites simultaneously?
A: Yes. Combining platforms addresses the specialization problem. Use the gas-focused platform for gas, Snaplii for regular retail, and the grocery-focused platform for groceries. This stacking strategy elevates annual earnings to $400 to $600+ depending on spending patterns, though it requires tracking multiple accounts.
Q: Does cashback rate transparency matter when comparing platforms?
A: Absolutely. Snaplii and Platform B publish rates clearly. Platform E and some others hide rate structures. Transparent rates let you calculate expected earnings before committing time to the platform, eliminating unpleasant surprises when redemption time arrives.
Maximizing Your Cashback Earnings Strategy
Cashback websites differ dramatically when you examine actual earnings instead of advertised maximums. Base rates of 1 to 3% versus 5 to 12%, withdrawal delays measured in days or weeks, and minimum thresholds that trap small balances all reshape real rewards.
Ranking by actual earnings reveals that no single platform dominates across all purchase categories. Specialization creates winners: Platform D for gas, Platform C for groceries, Platform B for flexibility, Snaplii for consistent all-category rates, and Platform A for partner network breadth.
The path to maximum earnings runs through matching your spending to platform strength and accepting that realistic annual rewards total $150 to $400 for typical usage. Adjust your expectations from the "40% back" marketing claim to the actual $150 to $300 you will earn, and cashback platforms become a legitimate, low-effort income source rather than a disappointing side hustle.
Sources
Best Cashback Websites Compared: Top 10 Picks for 2026 – Savings Grove
I Tested 24 Cashback Sites: Here Are the Only 10 That Actually Pay (2026) - MoneyPantry
Best Cashback Apps and Sites for Shopping Rewards (2026)
The Ultimate 2026 Guide to Stacking Cashback Apps for Maximum Savings - Gold Points
How I Earned $90 Using Cash-Back Apps for a Month - AARP
I Tested 15 Cashback Apps for 6 Months: See the Winners - Visu Network
How Minimum Redemptions Can Devalue Credit Card Rewards - NerdWallet
Issue Spotlight: Cash-back Fees - Consumer Financial Protection Bureau